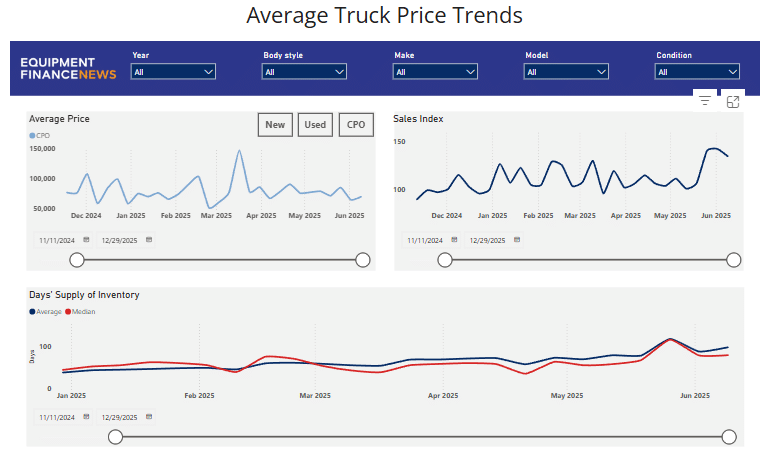
Days’ supply of inventory for new, used and certified pre-owned trucks rose while new and used truck prices declined amid mixed sales performance during the past six months.
The average price of a new truck sat at $155,013 as of June 9, down 10.8% compared with Dec. 9, 2024, according to new Equipment Finance News data launching today. During the same period, the average price of a used truck fell 6.7% to $42,092 and the average price for a certified pre-owned (CPO) truck jumped 18.7% to $69,900.
Inventory averaged 97.02 days’ supply industrywide as of June 9, up 156.7% since Dec. 30, 2024, according to EFN’s days’ supply index. The average new inventory landed at an index value of 134.02 on June 9, while the average used inventory value totaled 93.13 and average CPO inventory value finished at 108.
Truck sales volume has shifted, with the EFN’ sales index landing at 135 as of June 9 compared with 130.3 as of March 10 and 115.6 as of Dec. 9, 2024. The index measures overall sales volume indexed to January 2025 as a baseline, serving as a benchmark tool for how sales are performing.
Price, inventory and sales data can be sorted by model year, body style, make, model and condition. Most datasets are updated every day.
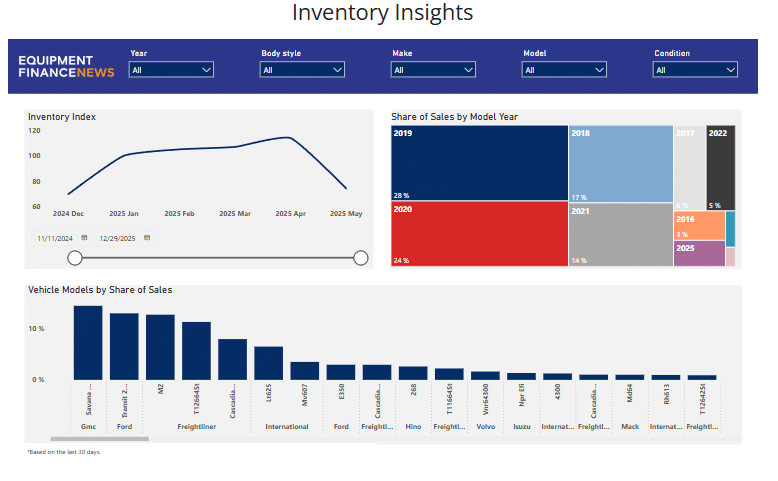
Inventory Insights
EFN’s inventory insights interactive dashboard provides insights into market-level inventory trends, model year distribution and top-selling truck models to help lenders manage portfolio exposure and align loan strategies with current demand. The dashboard is updated daily with data from the previous day.
Key features include an Inventory Index that tracks monthly inventory shifts, a breakdown of sales by model year and a list of top-performing truck models over the past 30 days for residual value planning. Users can refine results using filters for body style, year, make, model and condition.
For example, more than half the sales by model year came from 2019 and 2020 since Nov. 11, 2024, with 2019 models representing 28% of all truck sales while 2020 models representing 24% of all truck sales.
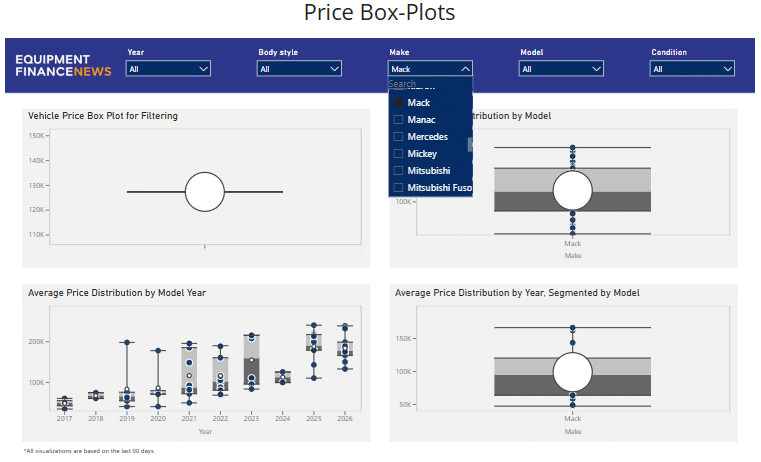
Comparing price ranges
New price box plot data offers insight into how prices range and compare across specific brands, models and makes, and model year. Distribution information by model and make allows for a comparison of price ranges across brands and specific models, while model year distributions show pricing trends by production year to support residual value analysis.
For example, prices by truck model year show that newer trucks generally cluster within a higher price range while older models have more variation and drop-offs in price. The data can be used to determine depreciation patterns and how price dispersion widens over time, useful for residual value forecasts.
Cluster boxes on the plots reflect 50% of the trucks that fall within the median price range. For example, the cluster for Mack trucks that are model year 2025 or 2026 was concentrated at higher prices compared with older model years, based on data from the past 90 days.
Price vs. mileage
Newly added truck price by mileage data analyzes the relationship between truck price and mileage to support loan structuring, collateral valuation and credit-risk assessment. The dashboard features pricing trends by mileage and model, helping lenders evaluate depreciation, adjust LTV strategies and identify higher-risk vehicles, with data also updated daily over a 90-day window.
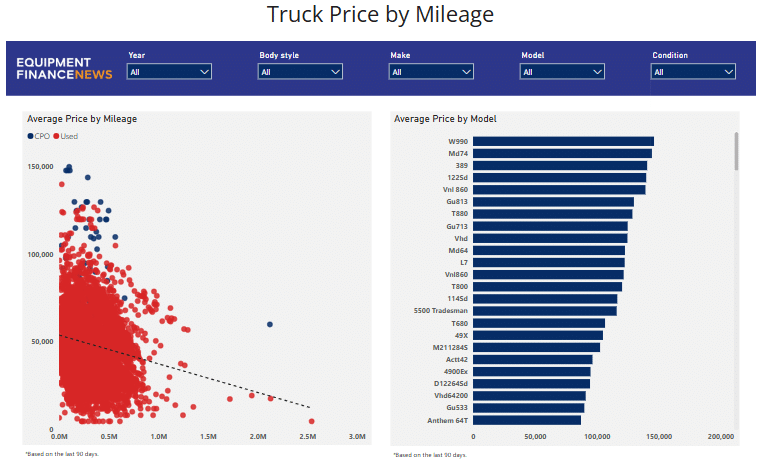
Additionally, truck price distribution data provides a detailed look at truck pricing trends by condition, mileage and brand, helping lenders track value shifts and market dynamics. The dashboard includes sales breakdowns by mileage and year-over-year price changes by brand, with daily updates and customizable filters for more targeted analysis.
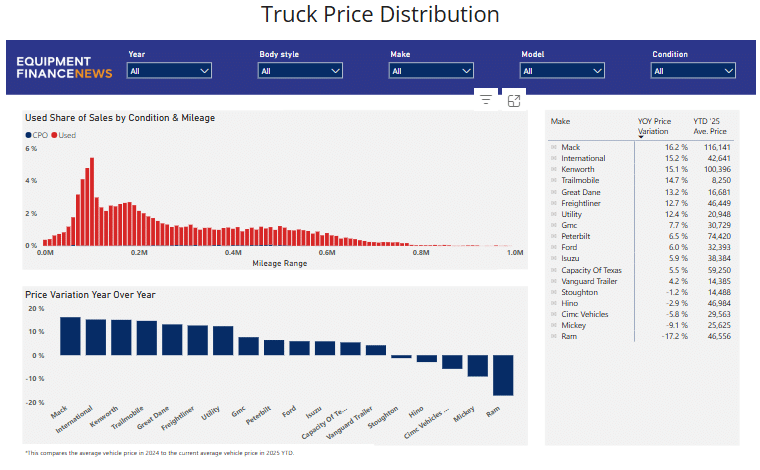
For example, Mack had the largest year-over-year price variation increase year to date in 2025 compared with 2024 at 16.2%. Meanwhile, Ram Trucks had the largest YoY price variation decrease year to date in 2025 compared with 2024 with a 17.2% drop.